A neat way to track data and display the aggregated information in a dynamic report
In closed applications, in applications with sensitive data or just because you believe in data security:
Matomo is the right way for web analytics. Google Data Studio is a great tool to visualize your data.
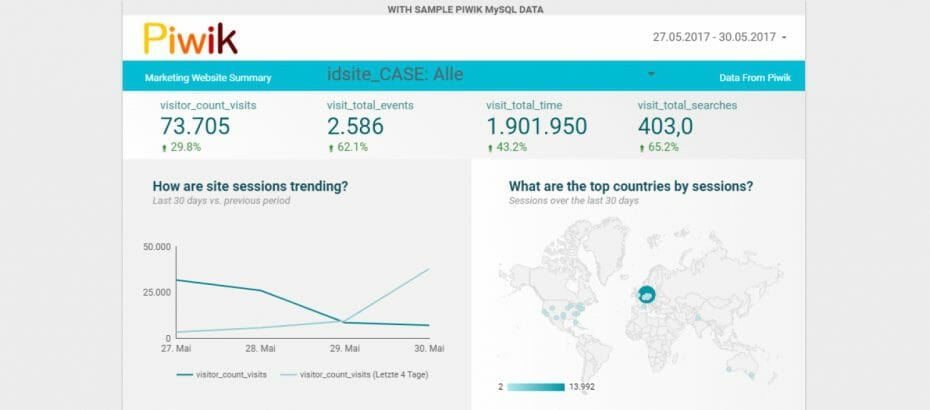
An example for a dynamic report in Google Data Studio with data from Piwik:
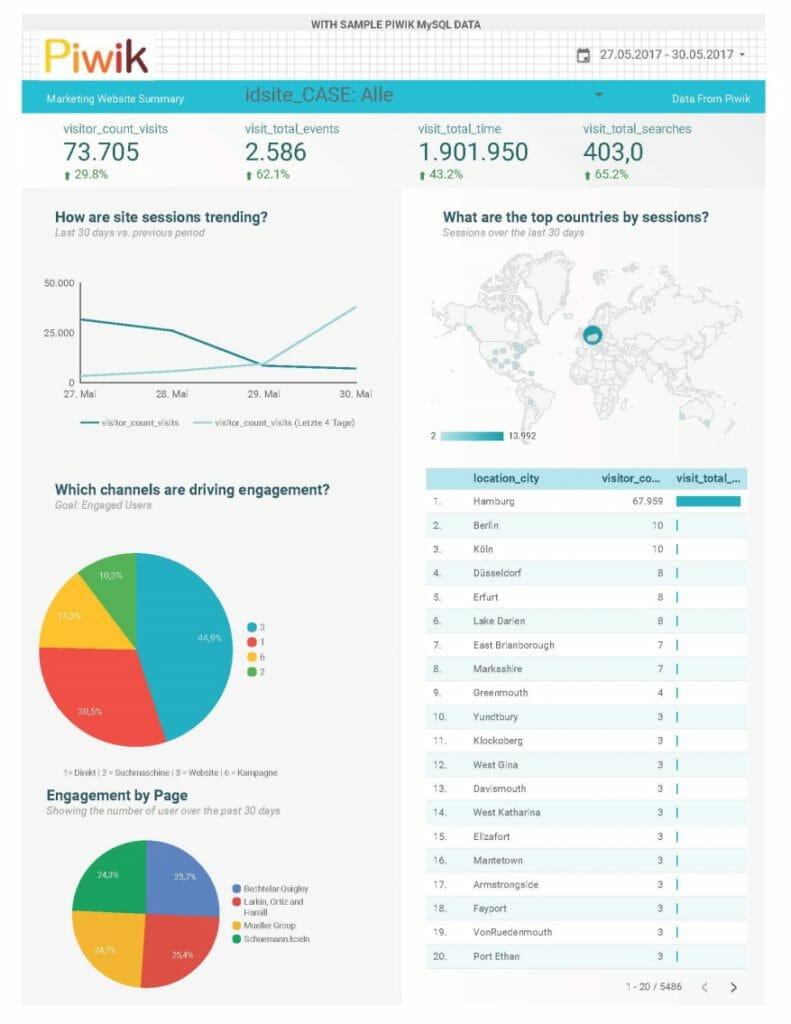
There are three different ways to import data into Google Data Studio. The simplest, is to upload your CSV file and create a report from that, but it is not dynamic.
For the well-known Google products there is a special “connector”. It works quite intuitively to create a nice and dynamic report with your Google Analytics data.
Most important, for the further steps is the MySQL connector. With which you can directly connect your Piwik MySQL database to Data Studio.
In your Data Studio you can start with a report template. Simply open the Acme Marketing report template and click on “select a new data source”. Here select the MySQL-Connector.
Keep in mind to allow the external connection on your own MySQL server, and that you will need the following information:
- Hostname or IP address
- Database
- Username
- Password
After you typed in your personal MySQL server information, you can choose a concrete table.
Piwik creates two different tables. You can find in ‚archive data‘ the aggregated data this is used to show you the reports directly in Piwik (Matomo). In the table ‚log data‘ you can find the raw data that is tracked.
Here I used raw data from the table piwik_log_visit
With three simple steps you can use this table for your report.
Check the table fields
Google Data Studio assigns every row a data field from the MySQL table. Like the known behaviour from Excel, every field gets a special type, like number, text or Boolean type. Unfortunately, some fields get an auto summary. Now it is important to check every single field and to select the right type. The easiest way to do that is to open your MySQL table with phpMyAdmin in a second window and compare both.
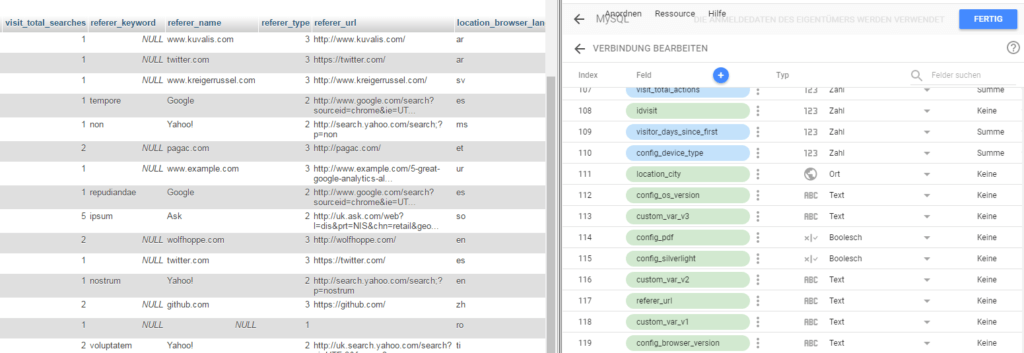
While you check the fields, you can correct the field names, too. The field name will be displayed in your report later. Simply click on the field name to change it.
In the screenshots I did not correct the field names, to show which field values will be used.
Create some formula
Some of your Piwik data needs a further calculation to be used in your Data Studio report.
To create a formula is simple: Click on the tab ‘Resources’ > ‘Manage data source’ > at MySQL on edit.
As always at Google, click the blue plus on top to create something new, like a calculating formula.
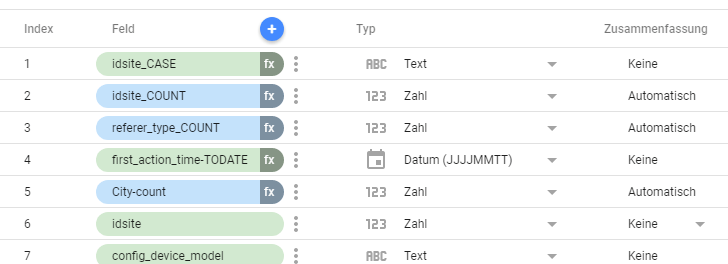
We will need the following formula:
- One, to introduce the date format to Data Studio
TODATE(first_action_time)- To calculate a measured value out of the dimension, simply count every value. We need that for multiple fields. Here is the example for “Number of visits per town”
COUNT(City)- In Piwik, values from categories are only saved as numbers. In the example below the different pages are saved as numbers from 1 to 4. In my report, they shall be displayed as the actual page name. With a combination of CASE, WHEN, THEN and REGEX_MATCH we can fix that.
CASE

WHEN REGEXP_MATCH(idsite, "1") THEN "Schuemann.koeln"

WHEN REGEXP_MATCH(idsite, "2") THEN "Bechtelar-Quigley"

WHEN REGEXP_MATCH(idsite, "3") THEN "Mueller Group"

WHEN REGEXP_MATCH(idsite, "4") THEN "Larkin, Ortiz and Hamill"

ELSE "Andere"

END
Make your report beautiful
We are on the home stretch. Our reward is now to work in the actual Data Studio report. Because right now, the report will show something like “Configuration incomplete”. To change that, simply click into your report and select the correct dimension or calculated value.
If you didn’t change it in the settings, the time frame you select once affects the global report.
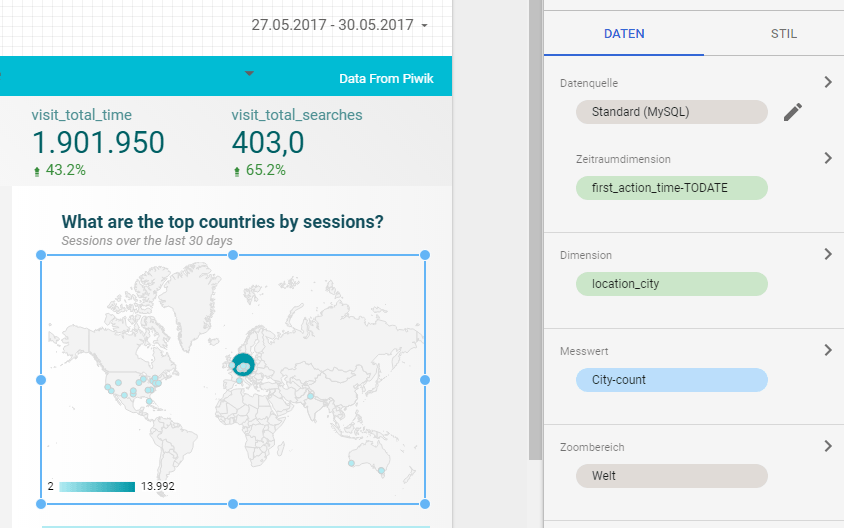
Now click every single chart and make your report beautiful.
You made it! You have created a dynamic report with your Piwik data.
Annotation
- Data Studio will send a lot of requests to your server. This might cause a server time out, especially at a shard hosting provider.
- I would recommend mirroring your SQL table. Then you can select which data google will see and is better for the performance.
Sources
Schema Piwik: https://developer.piwik.org/guides/persistence-and-the-mysql-backend
Connectoren: https://support.google.com/datastudio/answer/7088031?hl=en&ref_topic=7332343
Calculation: https://support.google.com/datastudio/answer/6299685?hl=de
List of all Data Studio feutures: https://support.google.com/360suite/datastudio/table/6379764

My New Book: The Ultimate Guide to Matomo
I’ve always been fascinated by the power of data and the insights it can provide as a web analyst. I’ve used a variety of analytics tools over the years to learn more about how visitors to my clients’ websites behave. One device that I have come to depend on is Matomo, an open-source tool that offers a strong and adaptable option in contrast to additional notable instruments like Google Analytics.
Hallo Eric,
vielen Dank für den Beitrag. Mit Google Diensten in Google Data Studio habe ich kein Problem. Die Anbindung meiner Matomo Datenbank funktioniert leider nicht, es kommt eine Fehlermeldung mit der Aufforderung, die Zugangsdaten zu überprüfen. Anscheinend ist der Zugang geschützt und man muss den Zugriff für bestimmte IP Adressen erst freigeben, wie Google schreibt. Leider habe ich keinen Zugriff auf den Datenbankserver bei meinem Provider, um dort die von Google angegebenen IP Adressen freizuschalten. Gibt es sonst noch eine Möglichkeit?
Vielen Dank & Grüße
Gerd
Hallo Gerd,
für den beschriebenen Web, braucht es den externen Datenbankzugriff. Du kannst ggf. bei deinem Hostinganbieter nachfragen, ob dies möglich ist.
Falls nicht, ist der Weg den Ronan hier beschreibt vielleicht der richtige für dich: https://youtu.be/0HqPbvVoJnU
Viele Grüße
Eric
Pingback: Display Matomo Data in Google Data Studio - Eric Schuemann